Sea level rise: how much, how fast, and which cities it reaches first
The slider in the simulator goes to 70 m, but nothing like that is coming this century. The numbers that matter within a human lifetime are far smaller — and still enough to redraw coastlines, because in many cities the land is sinking to meet the sea.
Sea level rise is two stories told in the same units. One is the global ocean, rising by millimetres a year. The other is local: a delta city pumping water from under itself can sink ten or fifty times faster than the ocean climbs. The sea arrives first where both happen at once.
How much and how fast sea level is rising
According to NOAA, global average sea level has risen 21–24 cm since 1880. The IPCC puts the rise between 1901 and 2018 at about 0.20 m, and the shape of the curve matters more than the total: the average rate was 1.3 mm a year in 1901–1971, 1.9 mm in 1971–2006 and 3.7 mm in 2006–2018.
Since 1993 satellites have measured the whole ocean surface, not just harbour tide gauges. By NASA’s count the sea has risen about 10 cm since then, and the rate has more than doubled, from about 2.1 mm per year in 1993 to about 4.5 mm per year in 2024. The year 2024 itself came in at 5.9 mm, well above the expected 4.3 mm, mostly because warmer water expands.
Millimetres sound harmless, but they raise the base under every high tide and storm surge. On US coasts NOAA finds high-tide flooding already several times more frequent than 50 years ago.
Why are sea levels rising
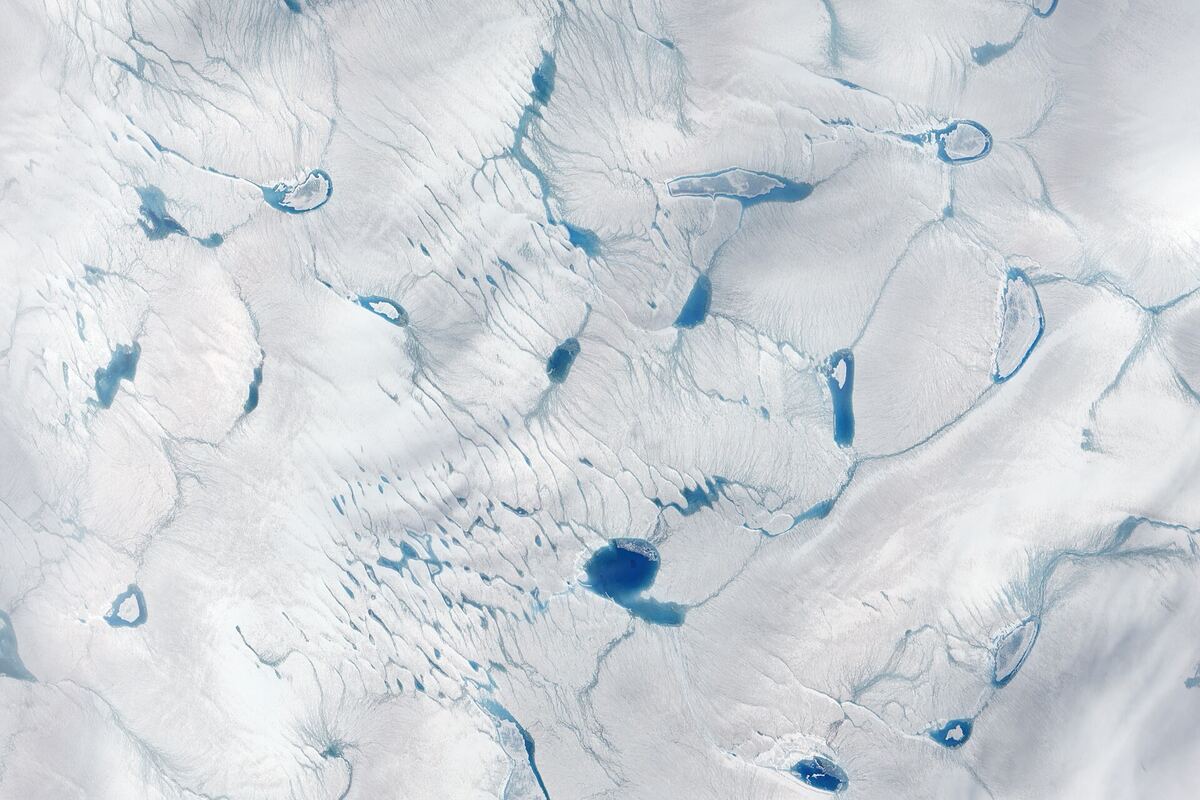
Two mechanisms, both driven by warming: seawater expands as the ocean absorbs most of the extra heat, and ice stored on land — mountain glaciers, Greenland, Antarctica — melts or slides into the sea.
For 1971–2018 the IPCC attributes 50% of the rise to thermal expansion, 22% to glaciers, 20% to the ice sheets and 8% to changes in land water storage. Ice sheet losses grew fourfold between the 1990s and the 2010s. The IMBIE team counts 21 mm of rise from Greenland and Antarctica between 1992 and 2020, almost two-thirds of it from Greenland. In most recent years, NASA says, meltwater has supplied about two-thirds of the rise; in 2024 the split flipped and expansion did.
Projected sea level rise by 2050 and 2100
For 2050 the scenarios barely diverge: the IPCC’s likely range is 0.15–0.23 m above the 1995–2014 average under very low emissions and 0.20–0.29 m under very high emissions. That rise is largely set already by heat in the ocean and ice that is already responding.
By 2100 the spread opens up, from 0.28–0.55 m under the very low scenario to 0.63–1.01 m under the very high one. On top sits a low-confidence branch in which parts of Antarctica collapse faster than models can reliably simulate. It stretches the high-emissions range to about 1.6 m, and the IPCC says a rise approaching 2 m by 2100 “cannot be ruled out”.
So the realistic range for this century is between a knee and a doorstep. Over the next 2,000 years the IPCC expects 2–3 m if warming is held to 1.5 °C and 19–22 m at 5 °C.
Where the big numbers come from
The larger values on the slider are not forecasts but inventories. Greenland’s ice holds about 7.4 m of sea level. Antarctica holds about 58 m, including roughly 3.3 m in the marine-based part of West Antarctica, which rests on bedrock below sea level and is considered the most vulnerable. All mountain glaciers together hold only about 0.3 m. Everything combined is roughly 65 m. Those are totals, not a schedule.
Losing all of Greenland would take many centuries, but the 7 m case shows what that ice would mean for a low country.
Raise the sea 7 m (all of Greenland) at Amsterdam →
What sea level rise maps show — and what they miss
A search for a sea level rise map, 2050 or worst case, usually lands on two tools. NOAA’s Sea Level Rise Viewer covers US coasts up to 10 feet above average high tide and separates areas connected to the ocean from isolated low pockets. Climate Central’s Coastal Risk Screening Tool covers the world by year, emissions scenario and annual flood level.
Nearly all such interactive maps use the bathtub model: raise a flat water surface over an elevation model and colour everything below it. Easy to read, easy to misread:
- Defences are mostly ignored. NOAA notes that its viewer does not model levees or other hydraulic structures, so Rotterdam or New Orleans can look drowned.
- Elevation data are imperfect. Global radar data read cities and forests too high. Correcting for this in 2019, Climate Central scientists tripled the estimate of people living below the current high tide line, to about 110 million.
- The land moves. A map of today’s elevation misses a city sinking centimetres a year, and coasts still rising after the last ice age, such as the northern Baltic.
- Storms matter more than averages. Damage comes from surges and high tides on top of the new average, which is why “worst case 2050” maps usually show annual flood levels.
The HazardSim simulator is a bathtub-style what-if on real elevation data: pick a coast, choose a rise, and see which low ground connected to the sea ends up below it. It builds intuition about scale; it is not a flood forecast.
Sinking cities: why subsidence beats the ocean locally
What matters on a given street is relative sea level: the ocean’s rise plus the sinking of the land, and in many delta cities the second term is larger. Pumping groundwater out of soft river sediments makes them compact like a squeezed sponge, permanently. A 2022 satellite radar study of the 48 largest coastal cities, led by Cheryl Tay, found the fastest sinking concentrated in Asia, with city-wide medians of up to about 16 mm a year and far faster local patches.
The hopeful half: unlike the ocean, subsidence can be switched off. Tokyo, Shanghai and Bangkok slowed it sharply by restricting groundwater pumping.
Jakarta — the city that is also sinking
Parts of North Jakarta sank 10–20 cm a year around the turn of the century and up to about 25 cm a year at the worst spots, mainly from groundwater extraction on soft coastal sediment. Large parts of the north coast now sit below high tide behind sea walls that keep having to be raised. Indonesia’s Geological Agency reports GPS rates of up to about 5 cm a year for 2015–2023 — slower, but still ten times the ocean.
Indonesia is building a new capital, Nusantara, on Borneo, partly for this reason. The move is legislated but unfinished: as of 2026 Jakarta legally remains the capital until a presidential decree transfers the status.
Raise the sea 1 m at Jakarta →
Miami and Florida sea level rise
South Florida sits on porous limestone, so sea walls help less than they look: the water comes up through the ground and the storm drains. Sunny-day flooding during the autumn king tides is now routine in Miami Beach, which has spent hundreds of millions of dollars on pumps and raised roads.
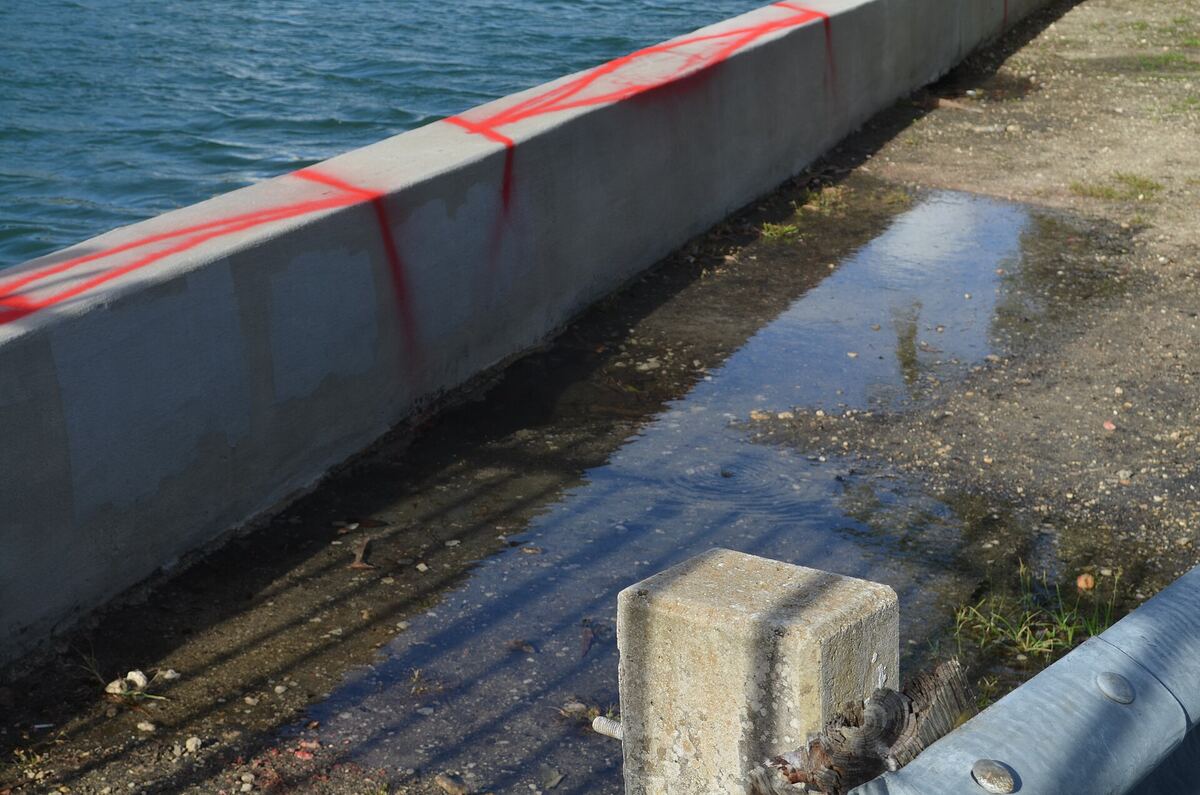
The 2022 US interagency report led by NOAA projects 10–14 inches (25–35 cm) of rise on the East Coast between 2020 and 2050 and 14–18 inches (35–45 cm) on the Gulf Coast. The Southeast Florida Regional Climate Change Compact plans for 10–17 inches by 2040 and 21–54 inches by 2070, relative to 2000. This is the clearest case where a bathtub map, the simulator’s included, understates the trouble, because it only models water coming over the shore.
Will New York be underwater by 2050?
No, but it will flood more often. The tide gauge at the Battery in Lower Manhattan has recorded about 2.9 mm a year since 1856, close to half a metre in total. The New York City Panel on Climate Change projects 14–19 inches (35–48 cm) of rise by the 2050s and 25–39 inches by the 2080s. That lifts the base for every storm surge like Sandy’s in 2012, which flooded subway tunnels in Lower Manhattan.
Venice and the MOSE barrier
Venice has settled over the last century while the Adriatic rose; industrial groundwater pumping on the mainland, halted in the 1970s, made the settling worse. On 12 November 2019 the tide reached 187 cm, second only to 194 cm in 1966, and flooded most of the historic centre.
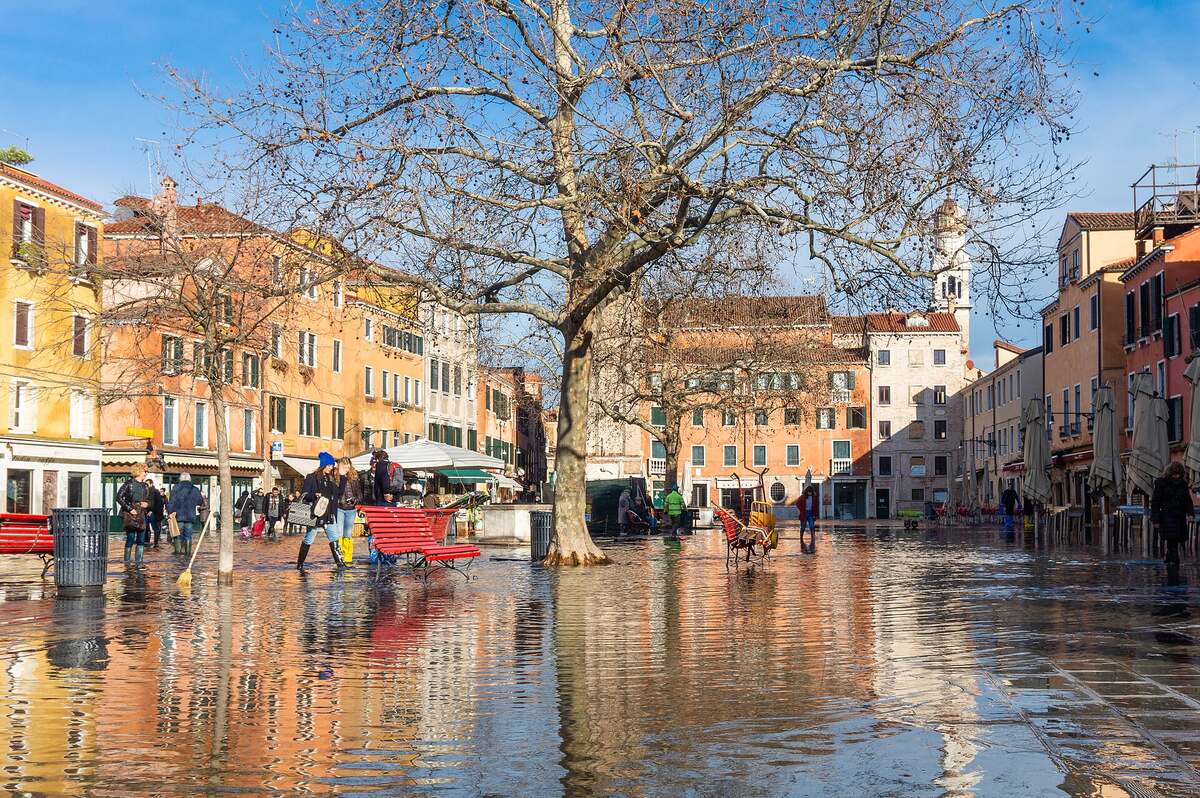
MOSE — 78 hinged steel gates across the lagoon’s three inlets — was first raised against a real high tide on 3 October 2020 and has since blocked dozens of exceptional tides. It goes up when forecasts exceed about 110 cm, so lower tides still wet the lowest squares, and it cost more than €5 billion. The catch is built in: the higher the sea, the more often the gates close, and a lagoon shut off from the sea too often stops being a healthy lagoon.
Bangkok, Ho Chi Minh City, Shanghai and Dhaka
Bangkok, on the soft clay of the Chao Phraya delta, was sinking up to about 12 cm a year in the early 1980s. Pumping controls brought the average down to around 1 cm a year, but the city lies barely above sea level and the lost height is permanent.
Ho Chi Minh City had the fastest typical sinking in the 2022 study of 48 coastal megacities, a median of about 16 mm a year.
Shanghai proves subsidence can be tamed. Its worst districts sank about 2.6 m between 1921 and 1965; after pumping limits and aquifer recharge, rates fell below 1 cm a year.
Dhaka is inland, but it is the capital of a country built on the Ganges–Brahmaputra delta, one of the lowest and most crowded coasts on Earth. There, sea level rise means stronger storm surges, salt in fields and wells, and migration into the capital; the 1970 Bhola cyclone surge killed hundreds of thousands.
Alexandria and Lagos
Alexandria sits at the edge of the Nile delta, starved of sediment since the Aswan dams. A 2025 study in Earth’s Future counted more than 280 building collapses along its coast in two decades, rising from about one a year to about 40. It linked them to shoreline retreat and seawater seeping under old foundations, and put about 7,000 buildings at risk.
Lagos, one of Africa’s largest cities, is low, flat and growing fast. Its new luxury district, Eko Atlantic, stands on reclaimed land behind a long sea wall — protection that covers only a sliver of a vast, low city.
Tuvalu, the Maldives and other small island states
Tuvalu’s highest point is 4.6 m above sea level, and most of the land is far lower. In 2023 it amended its constitution to declare that the state continues even if its territory is lost, and a treaty with Australia, the Falepili Union, offers up to 280 Tuvaluans a year permanent residence.
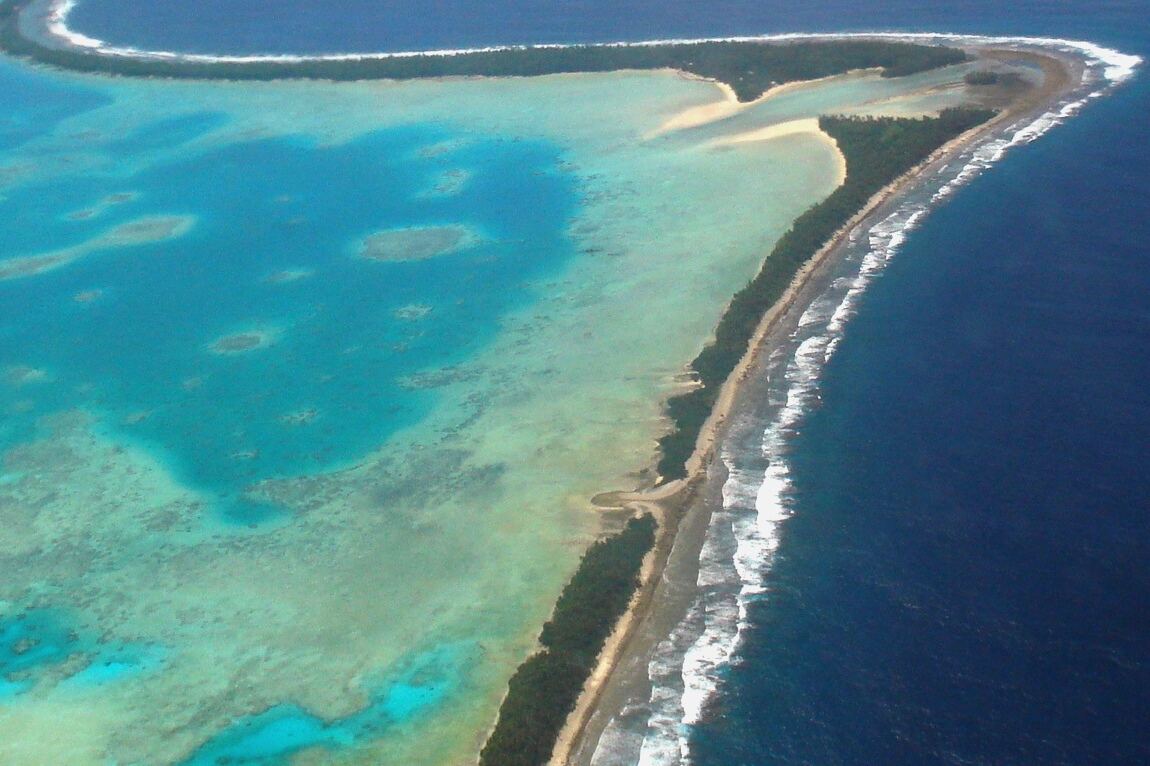
The Maldives, where most islands are under a metre high, is building higher ground instead: Hulhumalé, an artificial island raised about 2 m, already houses tens of thousands.
The Netherlands, which decided otherwise
About 26% of the Netherlands lies below sea level and 59% is susceptible to flooding. It stays dry because since the North Sea flood of 1 February 1953, which killed 1,836 people, the country has kept paying to keep it that way. The Delta Works closed off most of the southwestern estuaries with dams, sluices and storm surge barriers.
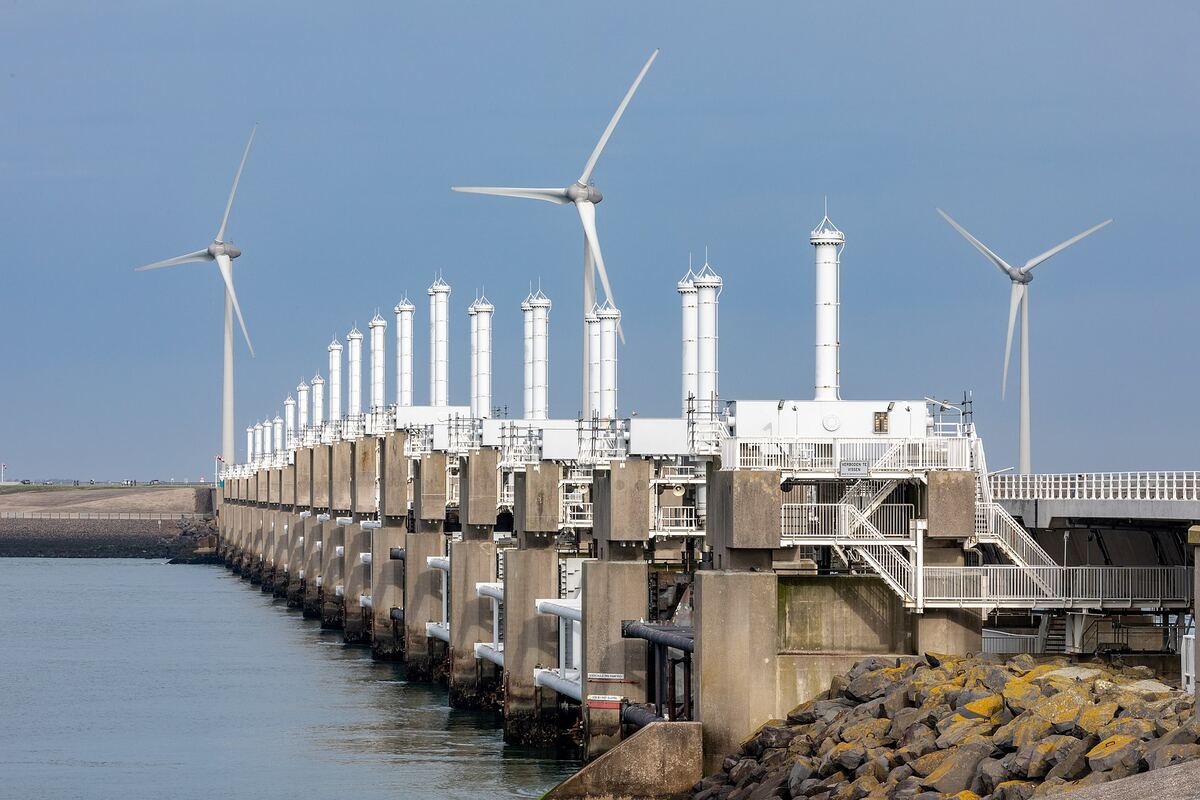
Height alone does not decide the outcome. Money, maintenance and politics finish the sentence. A rich, organised country can live below sea level; a poor, fast-growing delta city that is also sinking may struggle a metre above it.
The century’s real question is 1 m, not 60 m
The cities the sea reaches first are where low ground, sinking land and weak defences overlap. Jakarta, Ho Chi Minh City, the Bangladesh delta, Alexandria and Lagos score badly on all three. Miami is low and porous but rich; Venice and Rotterdam are low but defended; Shanghai and Bangkok showed the sinking can be stopped.
Set the simulator to 1 m on your own coast and see what it takes. That is the century’s actual question, not the 60 m one. Then look at what other visitors simulated in the last 30 days — usually far more than this century will bring.
FAQ
How fast is sea level rising right now?
About 4.5 mm per year, according to NASA — more than double the 2.1 mm per year of 1993. The ocean has risen about 10 cm since 1993 and 21–24 cm since 1880.
Why are sea levels rising?
Seawater expands as it warms, and ice on land melts or flows into the ocean. In 1971–2018 expansion caused about half the rise, glaciers 22% and the Greenland and Antarctic ice sheets 20%; in recent years meltwater has supplied roughly two-thirds.
How much will sea level rise by 2050 and 2100?
By 2050 the IPCC projects about 15–29 cm above the 1995–2014 average, with little difference between scenarios. By 2100 the likely range is 0.28–0.55 m with very low emissions and 0.63–1.01 m with very high emissions, and a rise approaching 2 m cannot be ruled out.
Will New York or Florida be underwater by 2050?
No, but both will flood far more often. NOAA projects about 25–35 cm of rise on the East Coast and 35–45 cm on the Gulf Coast between 2020 and 2050, with damaging high-tide floods more than ten times as frequent.
How accurate are sea level rise maps for 2050?
They show which ground is low, but most use a bathtub approach that ignores levees, relies on imperfect elevation data and leaves out sinking land. Treat NOAA’s viewer or Climate Central’s map as screening, not forecasts.
Which cities are most at risk of ending up underwater?
Those combining low ground, sinking land and weak defences: Jakarta, Ho Chi Minh City, Bangkok, the Bangladesh delta, Alexandria and Lagos. Rich low places such as the Netherlands and Venice are defended at great cost.
Sources
- IPCC AR6 WGI — Summary for Policymakers (A.1.7, A.4.3, B.5.3, B.5.4)
- IPCC AR6 WGI — Chapter 9: Ocean, Cryosphere and Sea Level Change
- NASA JPL — NASA analysis shows unexpected amount of sea level rise in 2024
- NASA Earthdata — The rate of global sea level rise doubled during the past three decades
- NOAA Climate.gov — Climate change: global sea level
- NOAA — U.S. coastline to see up to a foot of sea level rise by 2050 (2022 Sea Level Rise Technical Report)
- NOAA Office for Coastal Management — Sea Level Rise Viewer
- Climate Central — Coastal Risk Screening Tool
- Kulp & Strauss 2019, Nature Communications — New elevation data triple estimates of global vulnerability to sea-level rise
- IMBIE team 2023, Earth System Science Data — Mass balance of the Greenland and Antarctic ice sheets 1992–2020
- Morlighem et al. 2017, Geophysical Research Letters — BedMachine v3 (Greenland)
- Morlighem et al. 2020, Nature Geoscience — BedMachine Antarctica
- Bamber et al. 2009, Science — Potential sea-level rise from a collapse of the West Antarctic Ice Sheet
- Farinotti et al. 2019, Nature Geoscience — Ice thickness of all glaciers on Earth
- Tay et al. 2022, Nature Sustainability — Sea-level rise from land subsidence in major coastal cities
- Abidin et al. 2011, Natural Hazards — Land subsidence of Jakarta and its relation with urban development
- Phien-wej et al. 2006, Engineering Geology — Land subsidence in Bangkok, Thailand
- He et al. 2019, IJERPH — Land subsidence control zone and policy for Shanghai
- NOAA Tides & Currents — Relative sea level trend, The Battery, New York
- NPCC4 2024, Annals of the New York Academy of Sciences — New York City climate risk information 2022
- Southeast Florida Regional Climate Change Compact — Unified sea level rise projection (2019)
- Regional Environmental Change 2024 — Economic performance and future of the Venice flood protection system (MOSE)
- Fouad et al. 2025, Earth’s Future — Soaring building collapses in southern Mediterranean coasts (Alexandria)
- PBL Netherlands Environmental Assessment Agency — Flood risk figures for the Netherlands
- Rijkswaterstaat — Eastern Scheldt storm surge barrier
- Australian Government DFAT — Australia–Tuvalu Falepili Union treaty
- Library of Congress — Tuvalu constitutional amendment enshrines statehood in perpetuity