Ice age map
Wind the clock back 21,000 years. The ocean stands 130 metres lower, Siberia touches Alaska, the North Sea is a hunting ground and a wall of ice sits where Toronto and Stockholm are today.
What this map shows
The map above is the modern world with one number changed: the height of the sea. Pull the slider to any moment in the last 21,000 years and the ocean drops to where it stood then. Every piece of today's seabed that was above the water at that time turns sand-coloured, and the white sheets mark where the great ice caps lay. Pick a place from the list, search for any town, or tap the map to learn how far away the coast was from that spot.
Nothing here is a guess drawn by hand. The land that appears comes from real depth soundings of the sea floor, the water level follows a published reconstruction of global sea level, and the ice follows the mapped limits of the sheets at their largest. The page is built to answer a simple question for any coast on Earth: what was here when the mammoths were alive?

Why the ocean was 130 metres lower
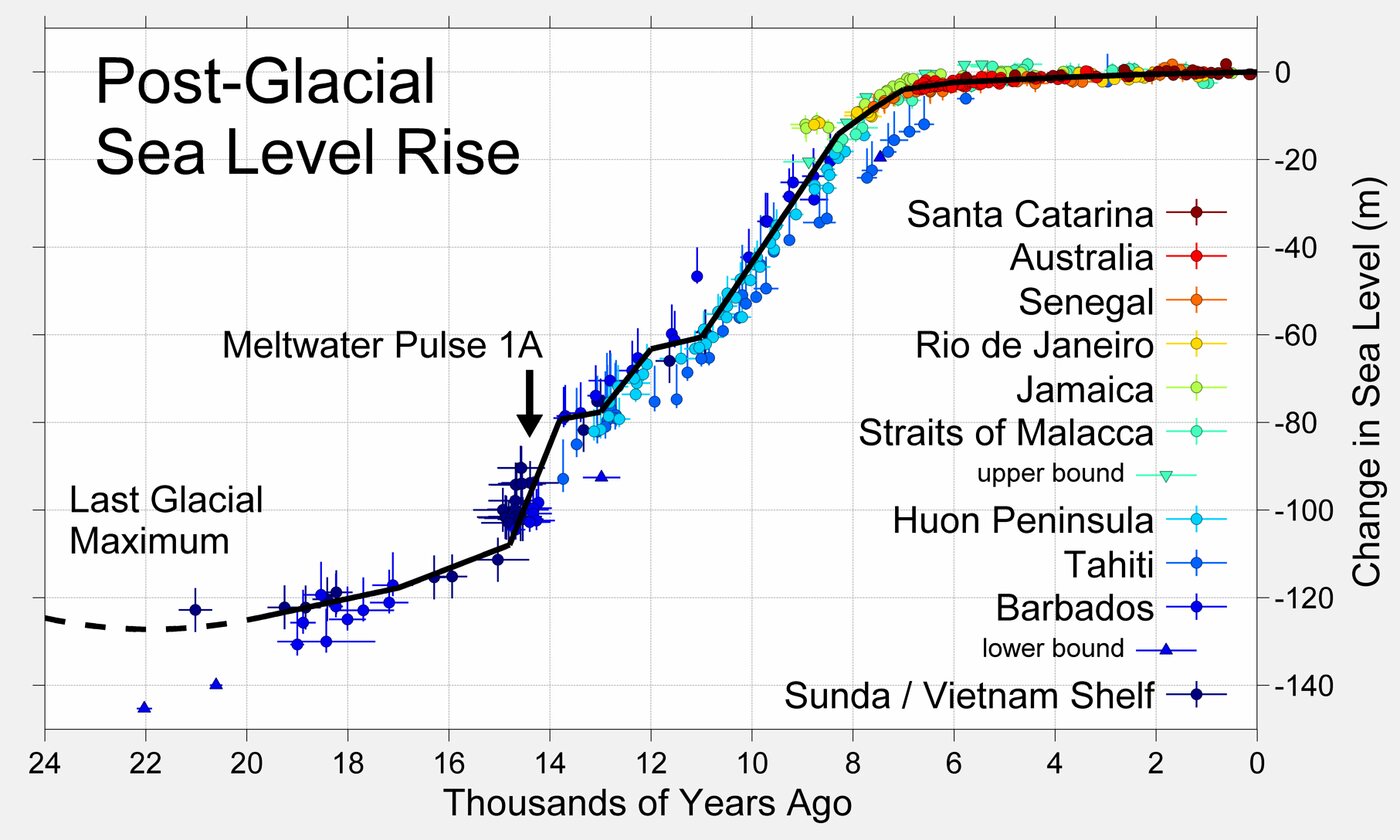
Water does not vanish from a planet. During the last glacial period it was simply parked somewhere else: in ice sheets up to 3 or 4 km thick that covered Canada, the northern United States, Scandinavia, the British Isles and the shelves of the Arctic. Enough water left the ocean to lower it by about 120 to 134 metres at the peak, 26,000 to 20,000 years ago. Geologists call this the Last Glacial Maximum.
The continental shelves are shallow, often less than 100 metres deep, so a drop of that size exposed enormous areas of them. The sea floor between Britain and Denmark, between Siberia and Alaska, between Malaysia and Borneo, and between Australia and New Guinea all became land. Rivers crossed these plains, animals grazed them and people lived on them. Then the ice melted, the water came back, and the plains went under in a few thousand years.
When the sea came back
The rise was not steady. For several thousand years after the peak the ice barely moved. Then, from about 16,500 years ago, the sheets began to collapse, and the ocean rose by roughly 12 metres every thousand years until 8,000 years ago, with one burst around 14,500 years ago (Meltwater Pulse 1A) when it jumped about 20 metres in five centuries. The slider on this map follows the reconstruction by Lambeck and colleagues, published in 2014, rounded to whole metres:
| Years ago | Sea level | What was happening |
|---|---|---|
| 21,000 | −134 m | Last Glacial Maximum, ice at its largest |
| 18,000 | −124 m | Slow early melting |
| 15,000 | −103 m | Ice sheets collapsing, people in Beringia |
| 14,000 | −78 m | Just after Meltwater Pulse 1A |
| 12,000 | −58 m | Younger Dryas cold snap, rise almost stops |
| 10,000 | −41 m | Rapid rise resumes, Sundaland breaking up |
| 8,000 | −14 m | Doggerland reduced to islands |
| 6,000 | −3 m | Most ice gone, coastlines near their modern shape |
| 0 | 0 m | Today |
The lost lands
Beringia
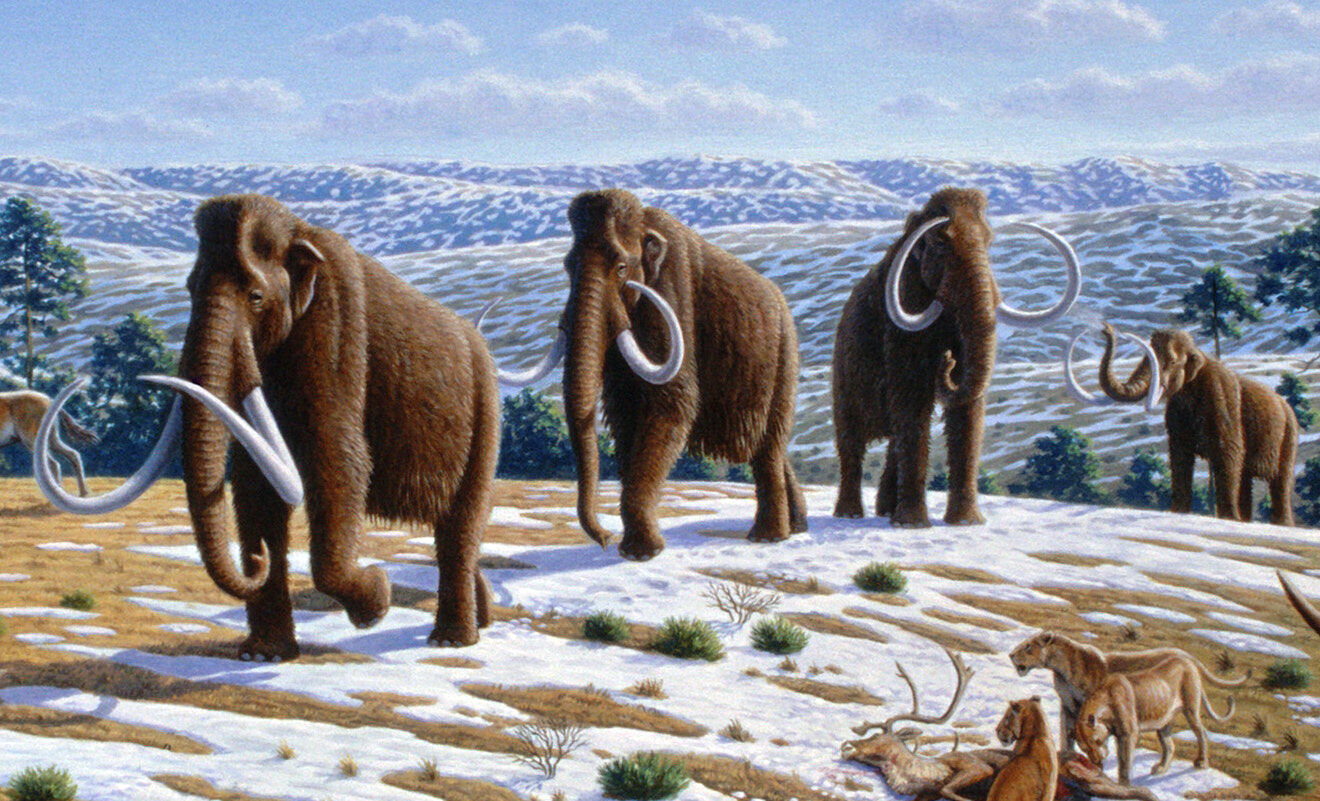
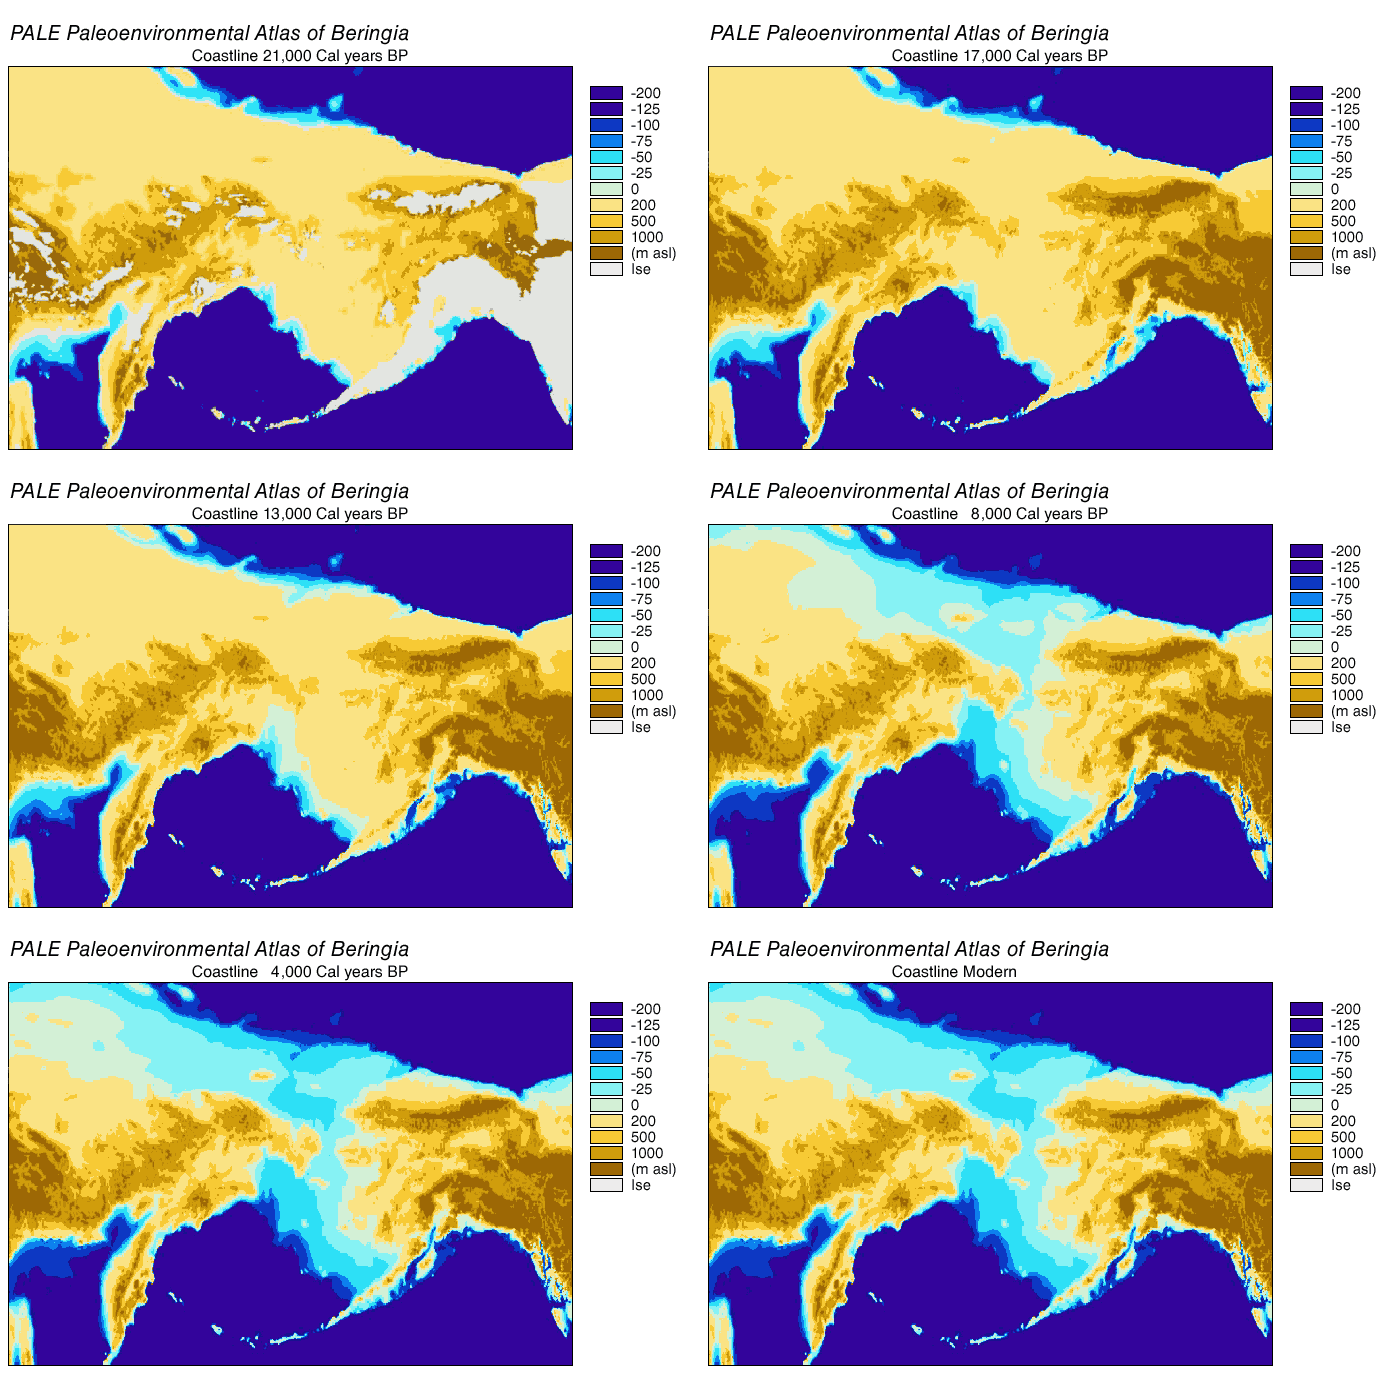
Set the slider to 21,000 years and look at the Bering Strait. The strait is only 50 metres deep, so it closed early and stayed shut for tens of thousands of years. The plain that replaced it, Beringia, was dry, windy grassland rather than the wet tundra of today, and it was full of grazing animals: mammoths, horses, steppe bison and the lions that hunted them. People lived here too, and from here they walked into the Americas by 16,000 years ago, possibly much earlier. The sea closed the strait again around 11,000 years ago.
Doggerland
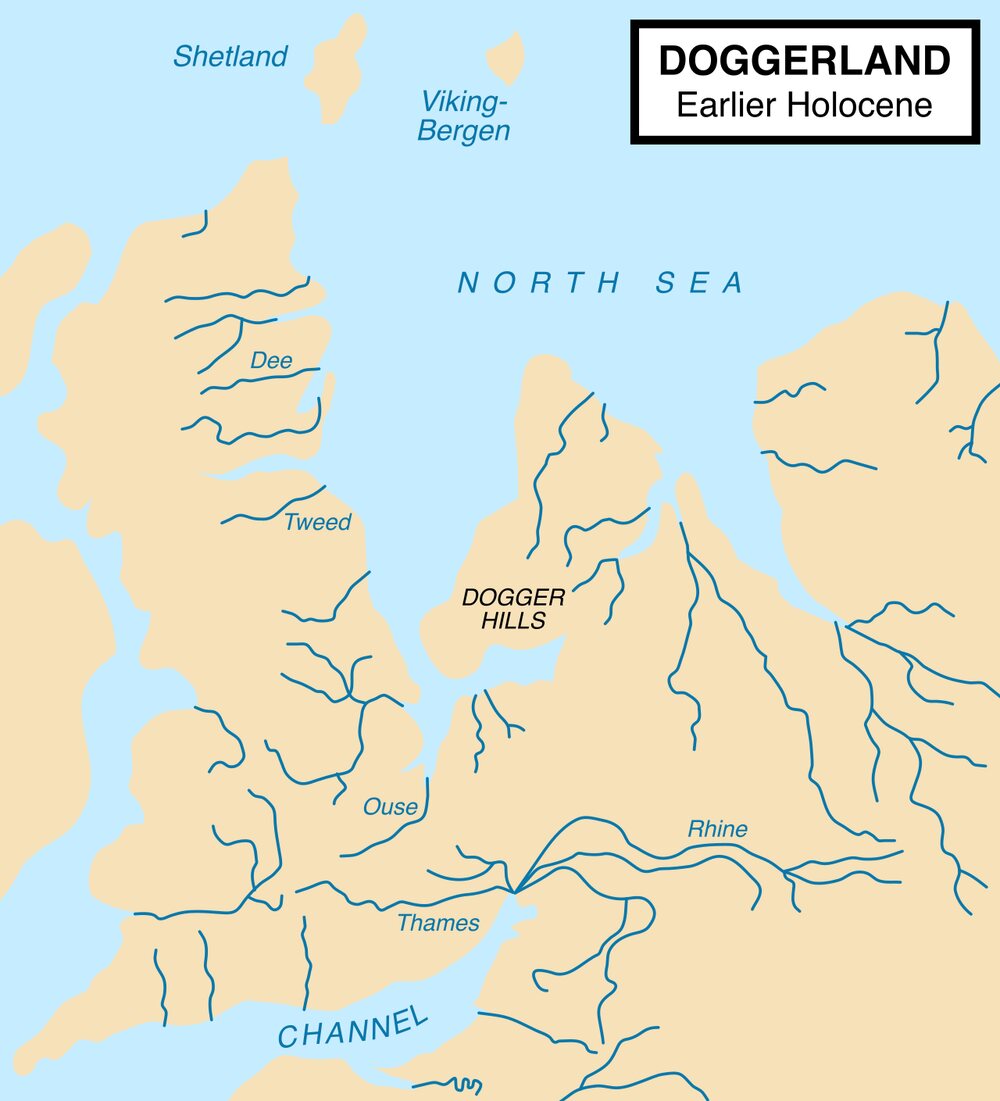
The southern North Sea is nowhere deeper than 50 metres, and at the glacial maximum all of it was land: a plain of rivers, lakes and marshes joining Britain to the Netherlands, Germany and Denmark. Archaeologists call it Doggerland after the Dogger Bank, a sandbank that is the last high ground of that plain. Fishing boats keep bringing up its past: mammoth bones, harpoons carved from antler, flint tools and peat with tree roots still in it. By 8,000 years ago the rising sea had cut Doggerland down to a large island on the bank. Around 8,150 years ago a huge underwater landslide off Norway, the Storegga slide, sent a tsunami across what was left, and within a few more centuries it was all under water.

Sundaland
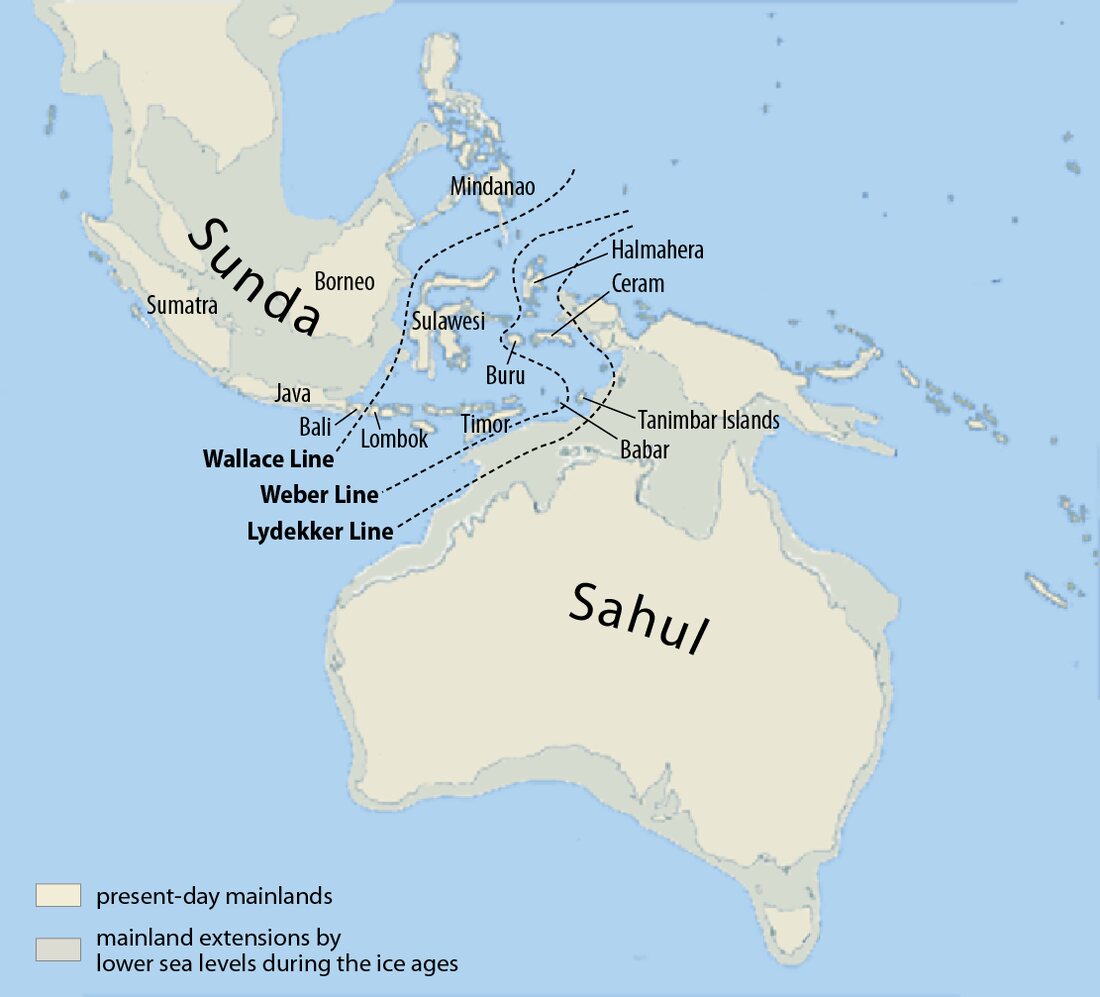
The biggest lost land of all is in Southeast Asia. The sea between Malaysia, Sumatra, Java and Borneo is shallow, mostly under 40 metres, and at the glacial maximum it was a single landmass larger than India, called Sundaland. Rivers that now end at the coast of Sumatra and Borneo once joined in the middle of what is now the South China Sea. Sundaland drowned fast, between about 14,000 and 8,000 years ago, and its coastline moved inland by hundreds of kilometres in a few human lifetimes.

Sahul
Across the Wallace Line the same thing happened to Australia: joined to New Guinea across the Torres Strait and to Tasmania across Bass Strait, it formed a continent called Sahul. The deep water of the Timor Sea and the Banda Sea never closed, which is why the first Australians, at least 50,000 years ago, had to cross open sea to get there. Bass Strait flooded about 12,000 years ago and the Torres Strait about 8,000 years ago.
The Persian Gulf, the Black Sea and Florida
The Persian Gulf averages only 35 metres deep, so for most of the glacial period it was a river valley: the Tigris and Euphrates ran across its floor and reached the sea only at the Strait of Hormuz. The Black Sea was cut off from the Mediterranean by the shallow sill of the Bosporus and became a lake standing well below the ocean, with a dry plain across its north-western shelf. Florida was about twice its present width, with the Gulf of Mexico coast up to 150 kilometres west of Tampa. Springs that are now on the sea floor were watering holes for mastodons and for the first people in Florida.
Where the ice was
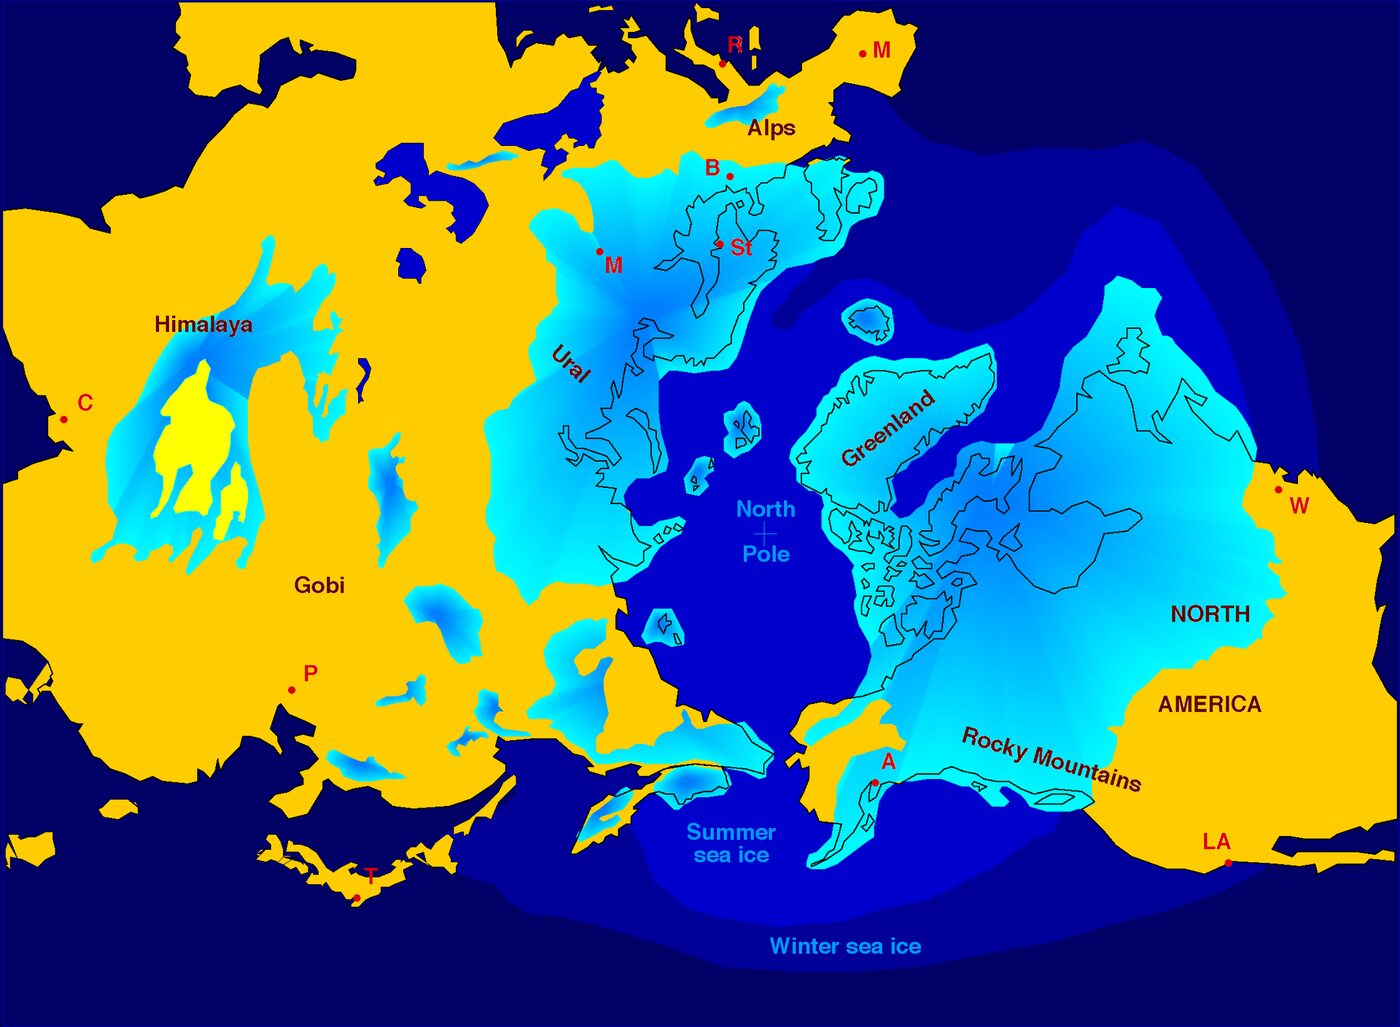
At the glacial maximum the Laurentide ice sheet covered Canada and reached as far south as New York, Chicago and Seattle. Its surface stood over 3 kilometres above the ground near Hudson Bay; the weight pressed the crust down so far that the land there is still rising today. The Scandinavian sheet buried Norway, Sweden, Finland and the Baltic and joined the British sheet across the northern North Sea. Smaller caps sat on the Alps, the Pyrenees, the Andes, Patagonia, New Zealand and the mountains of Siberia.
On this map the ice follows the compiled outlines of the sheets at their largest. As you move the slider towards the present each sheet fades at roughly the time it disappeared: the British sheet by 15,000 years ago, Scandinavia by about 10,000, the Laurentide ice last of all around 7,000 years ago. Greenland and Antarctica never melted and are shown throughout.

How the map is made
The exposed seabed comes from the same elevation data as the rest of HazardSim: a global grid that includes ocean depths from the ETOPO1 model, at roughly 2 kilometres per cell in the sea. A cell is painted as land when it lies below today's sea surface and above the sea level you have chosen. Lakes and basins that are below sea level but cut off from the ocean, such as the Caspian Sea, the Dead Sea and the Qattara Depression, are left alone. The area figure in the panel adds up the painted cells in view.
The sea level curve is the ice-volume reconstruction of Lambeck et al. (2014). The ice sheet outlines are the best-estimate glacial maximum reconstruction of Batchelor et al. (2019) for the Northern Hemisphere and the compilation of Ehlers, Gibbard and Hughes (2011) for the south, simplified for the web. The dates at which each sheet fades are approximate.
Two things the map does not do. It does not model the land itself moving: the crust under the ice sheets was pushed down by hundreds of metres and is still rebounding, so coasts near the former ice (Scandinavia, Hudson Bay, Scotland) were in a different place than a simple sea level drop suggests. And it does not model rivers, deltas or the sediment that has built up since, so the ancient plains looked rougher and wetter than a flat sand colour can show.
Questions
How much lower was the sea during the ice age?
About 120 to 134 metres lower than today at the peak, 26,000 to 20,000 years ago, depending on the reconstruction. This map uses 134 metres at 21,000 years ago.
Could people really walk from Asia to America?
Yes. The Bering Strait is shallow, so it was dry land from roughly 30,000 to 11,000 years ago. Archaeological sites show people in Alaska and further south by 16,000 years ago, and some finds suggest earlier.
Where was Doggerland and when did it sink?
Under the southern North Sea between England, the Netherlands and Denmark. It shrank as the sea rose, was an island by about 8,000 years ago and was gone a few centuries after the Storegga tsunami of about 8,150 years ago.
Is the sea still rising from the ice age?
The melt from the great ice sheets finished about 6,000 years ago, and the sea was close to its present level from then until the 20th century. The rise measured today, about 3 to 4 mm a year, comes from warming oceans and modern glacier loss. To see where that leads, use the sea level rise map.
Can I put this map on my own website?
Yes. Press Embed in the panel above the map, copy the code and paste it into your page. The embedded map opens at the place and the year you chose, and it is free to use as long as the HazardSim link stays.
The other hazards

Earthquake simulator
Put an epicentre anywhere on Earth, choose a magnitude, and watch the shaking spread over a real map — with an estimate of how many of the people living there it would kill.

Sea level rise map
Raise the ocean by a metre, by ten, or by every glacier on Earth, and see exactly which streets stop existing.

Hurricane simulator
Send a hurricane of any strength into a real coastal city and watch its storm surge run over real terrain, with the wind zones and an estimated toll.

Asteroid impact simulator
Drop a body of stone, iron, ice or loose rubble on any point on Earth and see the crater it digs, the fireball it makes and how far the shock wave breaks windows.

Tsunami simulator
Choose a coastal city, set the wave height at the shore, and watch the water climb inland over real elevation data until the ground beats it.

Volcano simulator
Erupt a real volcano at any size on the explosivity scale and see how far the pyroclastic flows and the ash would reach.